An online graphic equalizer with ten bands: move them, hear the change instantly over royalty-free music (or your own file), and watch the response curve redraw live. Load your own track and you can save it with the curve applied, as a WAV. When you like the curve, export a preset that drops straight into Equalizer APO, AutoEQ, Wavelet, Poweramp, or any tool that reads a parametric/graphic EQ file (a small text file listing each band's frequency and gain). Everything runs in your browser - nothing is uploaded.
Start from a preset
First time? Tap or click Harman-style and press Play. It is modeled on the research-derived target most listeners in Harman's tests preferred.
31
62
125
250
500
1k
2k
4k
8k
16k
31-62 rumble125-250 warmth500-1k body2k-4k presence8k-16k air
Auto pre-amp: 0.0 dB
Automatic cut that stops boosted bands from distorting (clipping).
Equalize your own file
Load a track with "Your file" above and this saves it with the current curve applied, as a 24-bit WAV at the rate your browser decoded it to (usually 44.1 or 48 kHz). The file is processed in your browser; nothing is uploaded.
Export your preset
Each band exports as a peaking filter at its slider frequency, with the auto pre-amp as the file's pre-amp setting (how the bands and the pre-amp work).
How a 10-band graphic EQ works
Ten bands, one overlapping curve
The sliders are labeled for the ISO octave centers, 31.5 Hz through 16 kHz (the bottom two sit at 31 and 62 Hz, within 2% of 31.5 and 63), and each one is a peaking filter at Q 1.4. That is the same shape Wavelet and Poweramp use to store a 10-band curve, which is why the export drops into them without translation.
At Q 1.4 each band is wider than the octave separating it from its neighbors, so the bands overlap. Two adjacent boosts add where their skirts meet, and the curve you actually get is taller than either slider reads. Ten sliders at +12 dB peak at +18.5 dB, not +12.
Why the pre-amp moves on its own
There is no headroom above 0 dBFS. Any boost that pushes the summed response past it clips the signal, and digital clipping is not subtle - it is the harshness people usually blame on the EQ itself.
So the auto pre-amp measures the peak of the whole summed response, not the tallest slider, and offsets by exactly that. Offsetting by the tallest slider alone would leave up to 6.5 dB of combined boost unhandled. The cost is level: the preset comes back quieter, and you make that up at the amplifier, where there is headroom to spare.
What a graphic EQ is really doing
Each slider on a graphic equalizer is a filter centered on a fixed frequency. Moving it applies a bell-shaped boost or cut around that center, tapering off to either side - so a change at 1 kHz inevitably touches its neighbors too. The bands are not independent channels.
How wide that bell is comes down to Q. A low Q affects a broad span and sounds like tone control; a high Q is surgical and is what you want for a narrow resonance. A ten-band EQ on ISO centers is deliberately broad, which makes it good for shaping character and poor for removing a single sharp peak.
Boosting also costs headroom. Adding 6 dB at one frequency means the signal at that frequency is now 6 dB closer to clipping, which is what preamp gain is for: cut the whole signal by the size of your largest boost and the correction happens without distortion.
Worked example
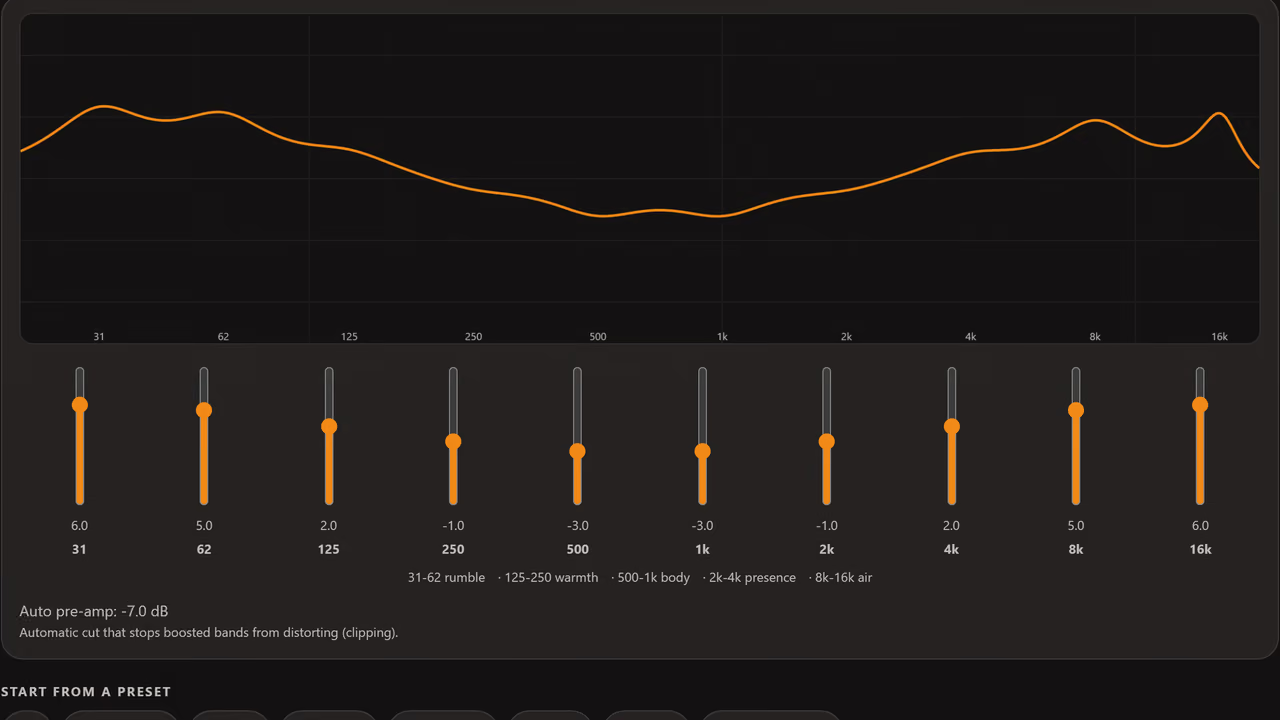
The built-in V-shape preset: +6 dB at 31 Hz and +5 at 62, dipping to −3 dB through 500 Hz and 1 kHz, then back up to +5 and +6 dB at 8 and 16 kHz.
The ten-band response curve those sliders produce, with an automatic pre-amp cut of −7.0 dB.
The pre-amp figure is the one people miss. Boosting bands pushes the signal past full scale, so the simulator pulls the whole curve down far enough to keep the peaks under it - which is why a heavily boosted preset always sounds quieter before it sounds bigger.
The ideas behind the controls
Center frequency
Where a band has its maximum effect. Octave centers double each step - 31.5, 63, 125 and so on in the ISO series, labeled 31, 62, 125 on the sliders here - because hearing works in octaves.
Q
How narrow the filter is. Higher Q means a tighter, more surgical adjustment; lower Q means a broader, more musical one.
Preamp gain
A global cut applied ahead of the filters so boosts have somewhere to go. Set it to at least the size of your biggest boost.
Cut before boost
Reducing what is too much rather than raising everything else. It costs no headroom and usually sounds more natural.
How do I use the EQ presets in Equalizer APO, Wavelet, or Poweramp?
Set the curve here, pick your app from the export dropdown, and copy or download the file. For Equalizer APO / Peace, paste the lines into config.txt (or import it in Peace). For Wavelet or Poweramp, save the ParametricEQ.txt and import it as an AutoEQ profile. Each band is exported as a peaking filter at its own slider frequency, 31 Hz to 16 kHz, which is exactly how those apps store a 10-band graphic EQ.
What is the auto pre-amp value and why does it matter?
Boosting any band raises the peak signal level, which can clip (distort) digitally. The auto pre-amp applies a matching negative gain to the whole signal so the loudest boosted band stays at or below 0 dBFS. Every export includes the pre-amp line; keep it - removing it is the most common cause of EQ distortion.
Is a 10-band graphic EQ enough, or do I need parametric?
For tone-shaping by ear - more bass, less treble, a vocal lift - ten bands at octave spacing is plenty and far easier to dial in. Parametric EQ matters when you are correcting a narrow headphone resonance or a single room mode and need a precise frequency and Q. This tool exports its bands as parametric filters, so you can take the curve into a parametric app and fine-tune from there.
Can I save my own file with the EQ applied?
Yes. Load the track with Your file, set the curve, and press Download equalized WAV. The file runs through the same auto pre-amp and ten peaking filters you hear, rendered offline in the browser, and comes back as a 24-bit WAV at the rate the browser decoded it to, usually 44.1 or 48 kHz. The A/B switch does not affect the download, and nothing is uploaded.
Does my audio get uploaded when I load my own file?
No. The file is decoded and processed entirely in your browser with the Web Audio API; it never leaves your device and is not stored. The same is true of the synthesized test tracks - everything is generated and played locally.
Why use peaking filters at fixed frequencies instead of shelves?
A graphic EQ models the whole response as a series of overlapping peaking (bell) filters at fixed centers, which sums to a smooth curve and maps 1:1 to the bands in Wavelet, Poweramp, and hardware GEQs. Shelves behave differently at the extremes, so keeping everything as peaking filters means the exported preset reproduces the curve you hear here.